Design
All About SaaS Dashboard – A Comprehensive Guide for Startup Founder

January 1, 2026
March 24, 2025

Smart dashboards fuel smart decisions
So would you prefer a way to set up a SaaS metrics dashboard for your team, bypassing all the hassles in a minute?
If so, you’re in the right junction!
Inside the article, you will explore everything on SaaS dashboard and understand how to build your one as a startup founder.
We also walk through the KPI metrics for SaaS dashboard that may deserve your attention and 7 insightful dashboard examples for improving your SaaS product’s performance.
What Is a SaaS Dashboard for Startup Founders?
A SaaS dashboard serves as a central hub that shows real-time insights into cloud software performance.
It helps startup founders review and evaluate crucial metrics like CAC (Customer Acquisition Cost), MRR (Monthly Recurring Revenue), ARPU (Average Revenue Per User), CLTV (Customer Lifetime Value) With real-time visibility that they can make timely decisions for product stability and business progress.
Why Does a SaaS Dashboard Matters to Founders?
Imagine steering a startup without knowing your growth pace or fuel level.
It feels like flying blind.
Now think of your dashboard as your instrument panel.
A SaaS dashboard informs you, flags issues early, and supports fast decision-making.
Here’s how a SaaS dashboard supports you
- Monthly Recurring Revenue (MRR): Shows steady monthly income from subscriptions to measure growth and revenue trends.
- Churn Rate & Customer Lifetime Value (CLTV): Tracks customer retention and revenue potential over a user's full engagement.
- User Activity & Engagement: Observes how users interact with your product and which features gain traction.
- Decision Support: Delivers accurate insights for founders to act quickly and lead with clarity.
A founder-focused KPI dashboard reduces uncertainty and saves hours of manual guesswork.
What Are The Top SaaS KPIs Metrics for Startup Founders?
You might ask, "Which numbers should I focus on?"
Here are crucial metrics for startup success:
Product Metrics
- User Activation: Tracks users who reach initial product value after signing up.
- Product Adoption: Counts returning users who pursue goals using your product.
- User Engagement (DAU, WAU, MAU): Measures user visits daily, weekly, or monthly.
- User Stickiness: Compares daily to monthly users to show engagement strength.
Financial Metrics
- Monthly Recurring Revenue (MRR): Tracks steady revenue from paying customers every month.
- Annual Recurring Revenue (ARR): Reflects projected income from subscriptions yearly.
- Customer Acquisition Cost (CAC): Calculates cost per customer from sales and marketing.
- Customer Lifetime Value (LTV): Forecasts total revenue from one customer.
- Average Revenue per User (ARPU): Reveals average income from each user account.
Marketing Metrics
- User Signups: Measures how many new users create trial or free accounts.
- Churn Rate: Shows how many users stop using the product within a period.
- Retention Rate: Reveals how many users remain active over time.
- Funnel Conversion Rates: Tracks user progress through marketing and onboarding stages.
- Product-Qualified Leads (PQLs): Identifies users who reach value and show buying intent.
Customer Success Metrics
- Customer Satisfaction Score (CSAT): Shows how happy users feel after using your product.
- Net Promoter Score (NPS): Indicates how likely users are to recommend your product.
Best SaaS Dashboard Examples to Inspire You
Let's explore eight different types of SaaS dashboards, the metrics they track, and their utility for your business.
1. New User Activation Dashboard
We are the top dashboard design agency and we offer a comprehensive view of product performance by monitoring user activity, company engagement, feature popularity, and emerging trends.
The Key metrics we included
- Daily, weekly, and monthly active users
- Daily, weekly, and monthly active companies
- Trends in active users and companies
- User engagement levels
- Most visited pages
- Top engaged users and companies
- Stunning call-to-action (CTA)
- Feature engagement statistics
- User retention analysis
- Hourly user activity
- Average session duration
- Product usage by browser
2. Customer Acquisition Cost (CAC) Dashboard
.webp)
This dashboard tracks the total investment required to acquire a new customer.
Metrics Included
- Customer acquisition cost
- Total revenue
- New Monthly Recurring Revenue (MRR)
- Total new customers
- Gross margin
- Churn rate
- Growth rate
3. SaaS Metrics Dashboard
.webp)
This dashboard monitors the process of converting new sign-ups into active users by tracking:
Metrics Included
- Monthly/weekly new sign-ups
- Activation conversion rate
- Activation conversion funnel
- Conversion trends
- Time to activation
- Time to activation trend
4. Core Feature Engagement Dashboard
.webp)
This dashboard measures user interaction with your product's main features, focusing on adoption rates, usage patterns, and retention.
Metrics Included
- Monthly unique users
- Usage trends (total vs. unique users)
- User engagement levels
- Feature adoption rate
- Adoption trends
- Monthly/weekly/daily user retention (by cohorts)
5. Trial-to-Paid Conversion Rate Dashboard
.webp)
This dashboard calculates the percentage of free-trial users who become paid subscribers, tracking.
Metrics Included
- Total trial-to-paid conversion rates
- Demo activations
- Number of trial users converted to paying customers
- Trial-to-paid conversion trends
- Time from sign-up to conversion
- Trends in time to conversion
6. Monthly Recurring Revenue (MRR) Dashboard
.webp)
Maintaining a healthy MRR is crucial for SaaS businesses. This dashboard tracks revenue patterns, trends, and benchmarks.
Metrics Included
- Month-by-month MRR
- MRR trends
- MRR breakdown by sources (new customers, upsells, reactivations, etc.)
- Comparison of MRR by customer segments, plans, dates, etc.
- MRR benchmarks
7. User Retention Dashboard
.webp)
User retention measures your product's ability to retain customers. This dashboard tracks retention over various intervals and user groups.
Metrics Included
- Monthly/weekly/daily retention for all users
- Retention trends by month, week, or day
- Monthly/weekly/daily retention for new users
- Retention trends for new users by month, week, or day
SaaS Dashboard Design Tips for Startup Founder
If your dashboard is messy, no one will use it.
Let’s keep it clean and easy to follow.
Here are some tips to make your SaaS dashboard design better:
1. Use bold numbers for KPIs
Present key performance indicators with large, bold fonts to ensure instant visibility and clarity.
.webp)
2. Group Related Metrics Together
Place similar data points in close proximity to create structure and simplify user comprehension.
.webp)
3. Add small Notes to Explain What Each Chart Shows
Include brief descriptions beneath charts to clarify purpose and guide user understanding.
.webp)
4. Avoid too Many Colors—stick to 2 or 3
Maintain visual consistency and reduce distraction by limiting dashboard color palette to two or three.
.webp)
5. Test your layout on mobile devices
Ensure proper layout adaptation by viewing the dashboard on multiple mobile screen sizes.
.webp)
Choose The Perfect SaaS Dashboard Design Agency
So, as a startup founder, if you understand them, these SaaS dashboard guide may assist you with tracking key goals and focusing attention on product essentials.
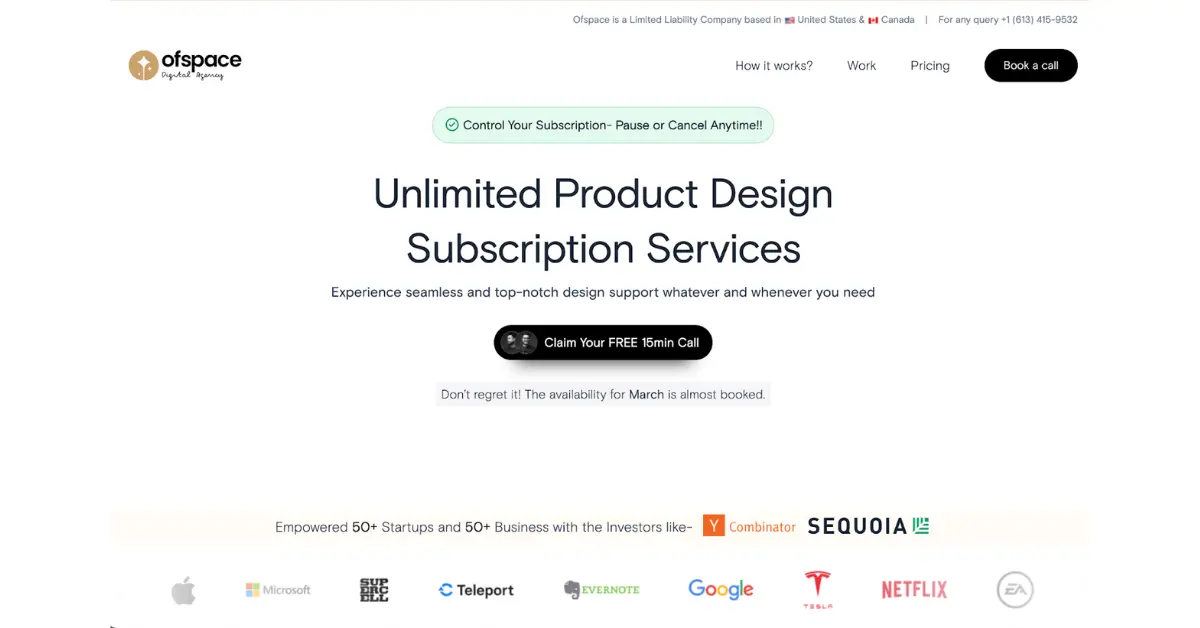
You can go for Ofspace Digital Agency that nurtures SaaS dashboard design for long and will connect your insights with your startup directly.
Besides, we are offering you tailored discount if your are the first visitor here!
Grab your Phone and dail us anytime you feel need. It’s free and candid!
Lastly, Start your design immediately.
Pick your KPIs.
Choose a tool.
Build your dashboard. And take control of your SaaS business.

FAQ on SaaS Dashbaord
What does SaaS stand for?
SaaS stands for Software as a Service, delivering software via the internet.
What are the 5 C's of SaaS?
The 5 C’s are:
- Conceptualization
- Creation
- Customization
- Collaboration
- Continuous Improvement
What are the three types of dashboards?
The three basic types of dashboards are:
- Strategic dashboards monitor
- Goalsoperational dashboards track activities
- Analytical dashboards analyze trends.