Resource
The Decision Spine: How to Tell If Your Dashboard Actually Works

July 15, 2026
July 15, 2026
.webp)
A few months ago we sat down with a client to review their product dashboard, expecting a fairly normal conversation about layout.
Too many cards, not enough breathing room, a chart that could probably be a table. That's usually where these calls start.
Ten minutes in, none of us were talking about layout anymore.
We were trying to answer a much smaller question: if a user opened this screen right now, would they know what to do next? Nobody in the room could say for sure.
The dashboard looked fine. It just wasn't clear what job it was doing.
We built a short framework for catching this, after noticing the same gap across a lot of different products.
It's three questions, and you can run it on your own dashboard in about ten minutes without opening a design tool.
If that scene sounds familiar, a dashboard that looks finished but leaves you with the same nagging feeling, this is for you.
It's usually not a design problem in the way people assume. Most broken dashboards aren't ugly.
They're structurally incomplete, they show you something true and then leave you standing there with it.
The Decision Spine
We start with three questions to check whether a dashboard has a clear path from information to response.
1. Signal
What needs the user's attention right now?
A signal is more than a general fact. It shows a change, risk, exception, or condition that may require a decision.
"340 tickets this week" describes activity. "12 tickets breached SLA" identifies a current problem.
That is the difference between a fact and a signal.
2. Evidence
What explains it?
Can the user move from the signal to the specific record, account, or event behind it without losing context?
For the SLA example, that means seeing which tickets breached, who owns them, how long they have been waiting, and which customers are affected.
The evidence does not need to live directly on the dashboard. It can sit in a detailed view, as long as the route is clear and the original context survives.
3. Action
What can the user do next?
When the product expects a response, the path to it should be clear.
For the SLA example, that might mean opening the ticket, reassigning it, escalating it, changing its status, or responding to the customer.
The action does not need to happen on the dashboard itself.
It only needs to be reachable without making the user remember the problem while searching for where to resolve it.
We call this the Decision Spine:
Signal - Evidence - Action
It is not a full product audit or a replacement for usability testing. It is the first structural check we run before discussing chart types, spacing, or visual hierarchy.
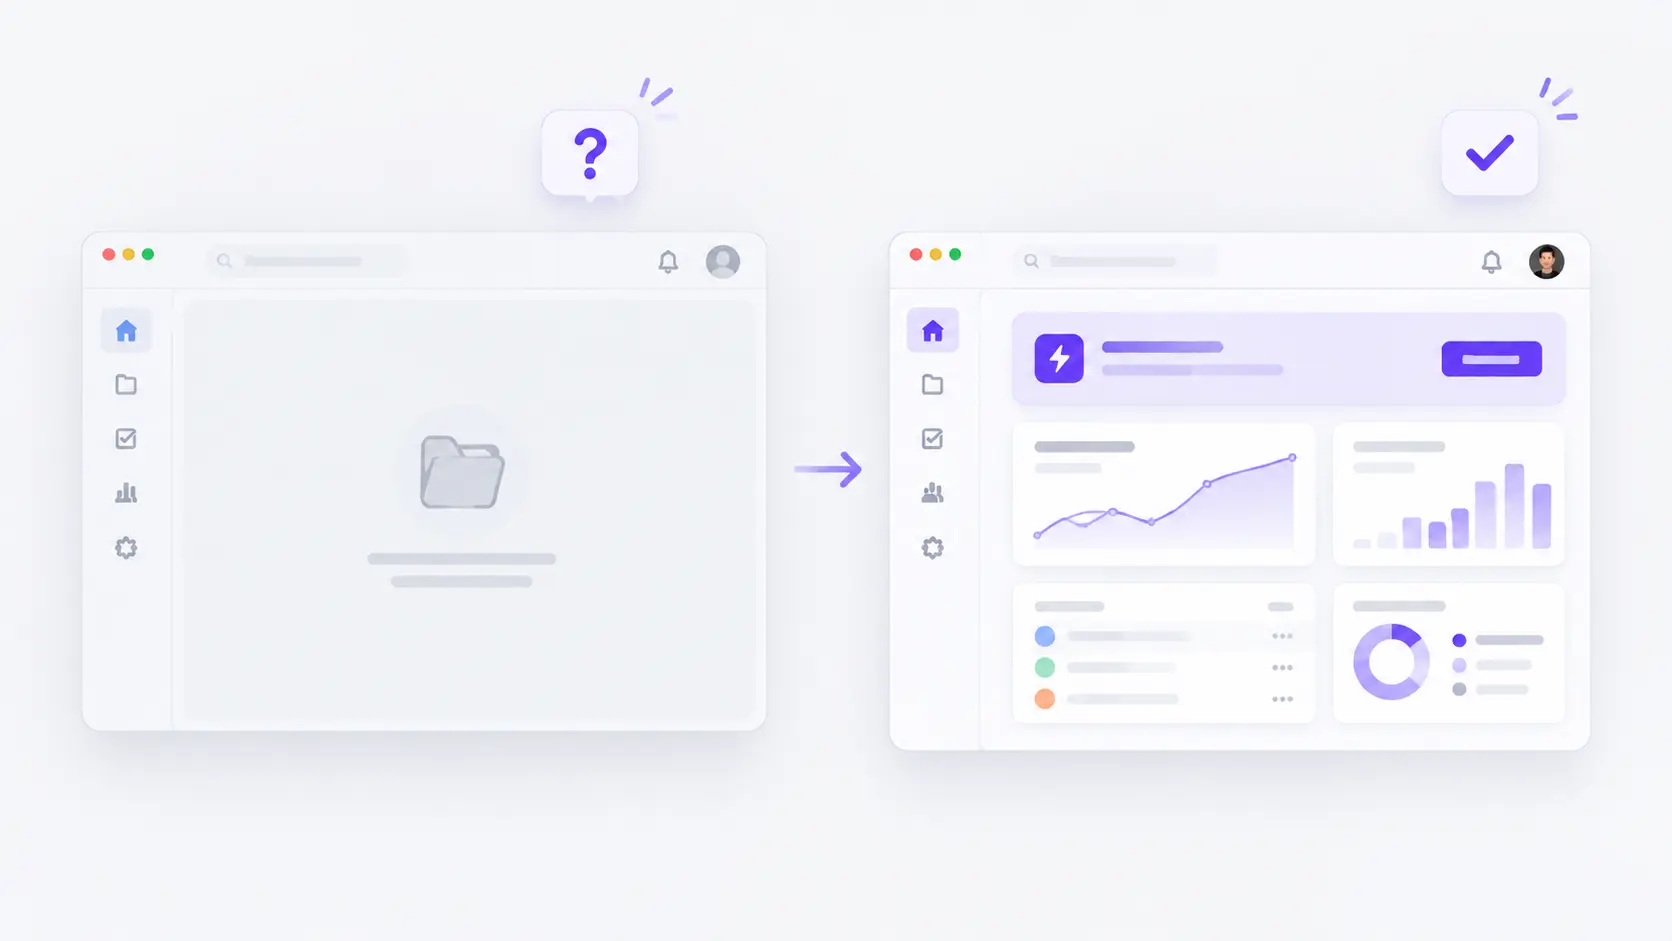
Here is what all three stages look like when they connect in one composite operational dashboard.

Run this on your own dashboard
Here's the test itself. You don't need a designer in the room for this part.
Open the dashboard you use most, or the one your team is proudest of, and work through these four steps.
1. Name the signal.
Find the loudest element on the screen. Try to say, in one sentence, what uncertainty it's actually resolving. If you can't, that's already a finding.
2. Trace the evidence.
Take that number and click it. See if it goes anywhere real, a record, a list, an account, anything specific behind it.
3. Find the action.
If the screen is implying something needs to be done, locate the actual control. Not on a different page. Not behind a login to another tool. Right there.
4. Write the diagnosis.
One sentence, describing exactly what you found. For example:
The dashboard shows the problem clearly, but resolving it happens in a different tool, and the context gets lost on the way there.
That sentence is usually the most useful thing you can hand your product team before approving a redesign, more useful than "make it feel cleaner."
Where this came from
We built this after reviewing 53 desktop dashboard views across SaaS, fintech, commerce, fundraising, and growth products.
It wasn't a usability study, we didn't watch real users on these products or measure what happened afterward.
It was a structural review, looking at what each screen showed and whether it gave the user anywhere to go with that information.
The finding that mattered most: 48 of the 53 dashboards made the user's situation reasonably clear.
Only 31 kept the next relevant action within reach. In our sample, the larger gap showed up after the information was already visible, not before.
We're careful about what that does and doesn't prove. We can't say this caused lower retention or explains churn, we didn't measure that.
What we can say is that it kept showing up, dashboard after dashboard, regardless of industry, and it's why we built the test above the way we did.
Why it usually breaks before you'd expect
If your dashboard failed the test above, it helps to know where these breaks tend to happen. The fix is different depending on the step.
If step one felt hard
A fact is not automatically a signal. Say your product shows 340 tickets this week.
True, and also not useful, because it doesn't tell anyone what needs attention.
Twelve tickets breached SLA is a signal. It points at something specific happening right now.
If you struggled to name the uncertainty your loudest element resolves, that's usually because the dashboard is full of accurate numbers that don't point at anything.
That's not a density problem. No amount of rearranging cards fixes it.
If step two felt hard
Say your team does lead with the SLA breach.
Can someone click into it and see which twelve tickets, who owns them, how long they've been open? Or is it just a red card sitting there, correct but sealed shut?
A number with no path behind it behaves more like an assertion than usable evidence.
The user either trusts it blindly or goes hunting for the record somewhere else, usually losing the original context on the way.
If step three felt hard
Say the evidence is there too, your team found the twelve tickets and knows who owns each one. Now what.
If resolving any of them means leaving the dashboard, opening a different tool, and hoping they remember the right ticket by the time they get there, the product has handed the work back to the user right after they did the hard part of understanding it.
This was the largest gap in our sample, step three is where most dashboards actually failed.
Fixing it might be as small as preserving context between two views, or as large as redesigning the workflow itself.
Action gaps don't always come from a design decision, sometimes they run into permissions, backend limitations, or an integration that was never built.
This is usually the part worth asking your team about directly.
Not "can we make the dashboard cleaner," but "once someone sees a problem here, where do they actually go to fix it, and does the product help them get there."
Not every dashboard needs to finish the chain
Worth saying plainly, because it's easy to over-apply once you have the test in hand.
A monitoring dashboard might stop at signal on purpose, a market overview exists to be watched, not acted on.
An analytical dashboard might get someone to evidence and stop there, the decision itself happens outside the interface, in a meeting or in someone's head. Neither of those is a failure.
A dashboard passes when it goes exactly as far as its job requires, and stops there on purpose.
It fails when it behaves like it wants a response, red numbers, bold borders, a sense of urgency, and then leaves the user standing there with nowhere to go.
How your team can use it
The Decision Spine gives designers and product managers a shared way to describe where a dashboard breaks.
For designers
Use it to make critiques more specific.
Instead of saying:
This feels busy.
You can say:
That is a fact, not a signal.
Or:
The alert is visible, but there is no path to the evidence behind it.
Experienced designers may already think this way instinctively.
The value of the framework is giving that instinct a shared name, so the team can identify the problem faster and discuss it without relying on taste.
For product managers
Use it before requesting components.
Compare these two requirements:
Add a KPI card for support performance.
Show the support lead how much SLA capacity remains, which tickets are creating the risk, and where they can respond.
The first requests a widget.
The second defines the signal, the evidence users need, and whether the product should support an action.
That gives the designer a problem to solve, not just a component to place.
The takeaway
The Decision Spine is simple:
Signal - Evidence - Action
Before changing the layout, check whether the screen makes the right thing visible, connects it to the evidence behind it, and gives the user a clear path forward when a response is expected.
In our sample, the larger problem was not how much information dashboards showed. It was where that connection broke.
So before the next conversation turns into cards, charts, or spacing, ask:
Does this dashboard know what the user needs to understand, and where the product should take them next?